
There are many lessons from the 1970’s and 80’s “Big Inflation” about interpreting reported financial results to determine if a public company is doing well or not. One of those lessons was wage inflation lagged, not led, price increases in goods and services. This stretched out the period of recession and was aptly named “stagflation”. A wage/price spiral ensued where increases in inflation led to wage inflation which led to higher prices which required more wage increases.
Based on our experiences with our portfolio companies this is proving true again in 2022, but the lag is less delayed. Labor scarcity has forced employers to respond quickly to a tight market as Payroll Protection subsidies enacted in 2020 kept many work forces in place. This is a sharp contrast to other labor disruptions like Big Inflation where employers fired workers to stay alive and unemployment was high. This time in 2021, when consumer demand returned, labor was not unemployed. In many cases wages began to rise quickly throughout the second half of 2021 and the first quarter of 2022 just to retain workers. Here is a chart from “The Daily Shot” demonstrating the sharp response:
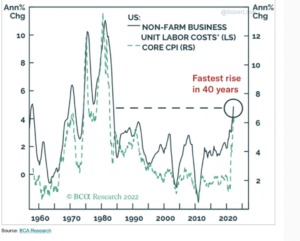
Notice the wage spikes in the 1970’s and 80’s, new highs were reached every 5 years as stagflation set in.
In 2022 the reason it is important whether wage increases are fairly reflected in projected earnings is public stock prices are now relying almost exclusively on companies’ meeting consensus earnings, not PE multiple expansion, as shown in this chart from The Daily Shot:
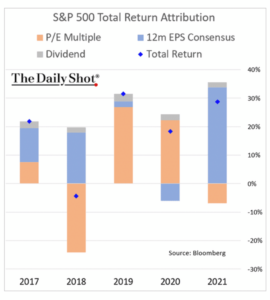
Notice the blue shaded area showing almost 105% of S&P 500’s 2021 35% return was attributed to companies making or exceeding consensus earnings. I have not seen S&P 500 return attribution statistics for Q1 2022, but I suspect companies are still raising prices faster than they are booking expense increases so reported earnings are still rising. I know this is the case for many of the companies in our PE portfolio. While they have responded quickly to rising costs like freight, energy and commodities, and have increased prices – sometimes 2 or 3 times over two years -wage expense increases still lag revenue. Consensus revenues and earnings may be met for Q2 ’22 even though a tidal wave of wages is on its way and alarm bells should be sounding.
This chart from The Daily Shot shows the rapid wage acceleration in 2022:
![]()
Second Quarter 2022 earnings are just beginning to come in, and I am wondering when companies will begin to disclose how inflation distorts reported EPS. For example, earnings calls should be dominated by questions about unit growth instead of revenue growth. Similarly, after at least 30 years of miniscule inflation, many company expenses like wages, commodities, imported components, and interest expenses, are rising and some at double digit rates. In many cases price increases are two quarters ahead of increases in cost of goods sold or selling, general and administrative costs. This suggests to me that reported earnings for the entirety of 2022 may be like the typical Cleveland Browns Sunday scoring pattern – great performances in the first quarter, ok performances in the second and a complete collapse in the second half when defenses realize Baker Mayfield can’t run, can’t see above the pocket, and can only rollout to his right.
FIFO Inventories Distort Trend Lines
Another relic from the 1970s was picking an inventory method that maximized earnings by using the oldest and cheapest inventories in costs of goods sold. This is especially true for hundreds of companies who have built forward inventories to address supply chain constraints. You may see companies abandon the LIFO (last in first out) method that matched well to the prior 30 years of disinflation but now threatens reported earnings by requiring the most recent and costliest inventories to be run through cost of goods sold first. For example, what it cost to build a tractor in 2019 was significantly cheaper in than it is in 2022 due to commodity and wage inflation. If you have each vintage in inventory, the 2019 version is significantly more profitable.
Track Units Not Revenues
Another lesson from the Big Inflation is the real revenue trend is established by the units you are selling not their revenues. If inflation is compounding at 8% and you can pass through price increases at 8%, revenues can double in 9 years without any growth in units sold. Apple has had declining unit growth in smartphones for years, but its revenue mix of fully loaded, most expensive smartphones has increased profitability every year. If units are declining and you can’t shift the product mix to higher margin items, profits will decline.
Leverage Can Benefit A Fixed Rate Debtor
Another lesson from the Big Inflation is that company leverage is a winning strategy. If your interest rate was fixed at low rates, you repay the lender with a fixed payment stream whose buying power is worth less every quarter in a high inflation environment.
Learning the moves for maximizing earnings is an important skill in an inflationary environment but being able to interpret the meaning of those results is existential.
The above commentary is for informational purposes only. Not intended as legal or investment advice or a recommendation of any particular security or strategy. Information prepared from third-party sources is believed to be reliable though its accuracy is not guaranteed. Opinions expressed in this commentary reflect subjective judgments based on conditions at the time of writing and are subject to change without notice.
Index Disclosure: An index is an unmanaged portfolio of specific securities, the performance of which is often used as a benchmark in judging the relative performance of certain asset classes. Investors cannot invest directly in an index. An index does not charge management fees or brokerage expenses, and no such fees or expenses were deducted from the performance shown. Index returns shown are price returns (PR), which exclude dividends and other earnings.
The S&P 500 Composite Index is a market capitalization-weighted index of 500 widely held stocks often used as a proxy for the stock market. It measures the movement of the largest issues. Standard and Poor’s chooses the member companies for the 500 based on market size, liquidity and industry group representation. Included are the stocks of industrial, financial, utility, and transportation companies.